
OEE: Past, present and future
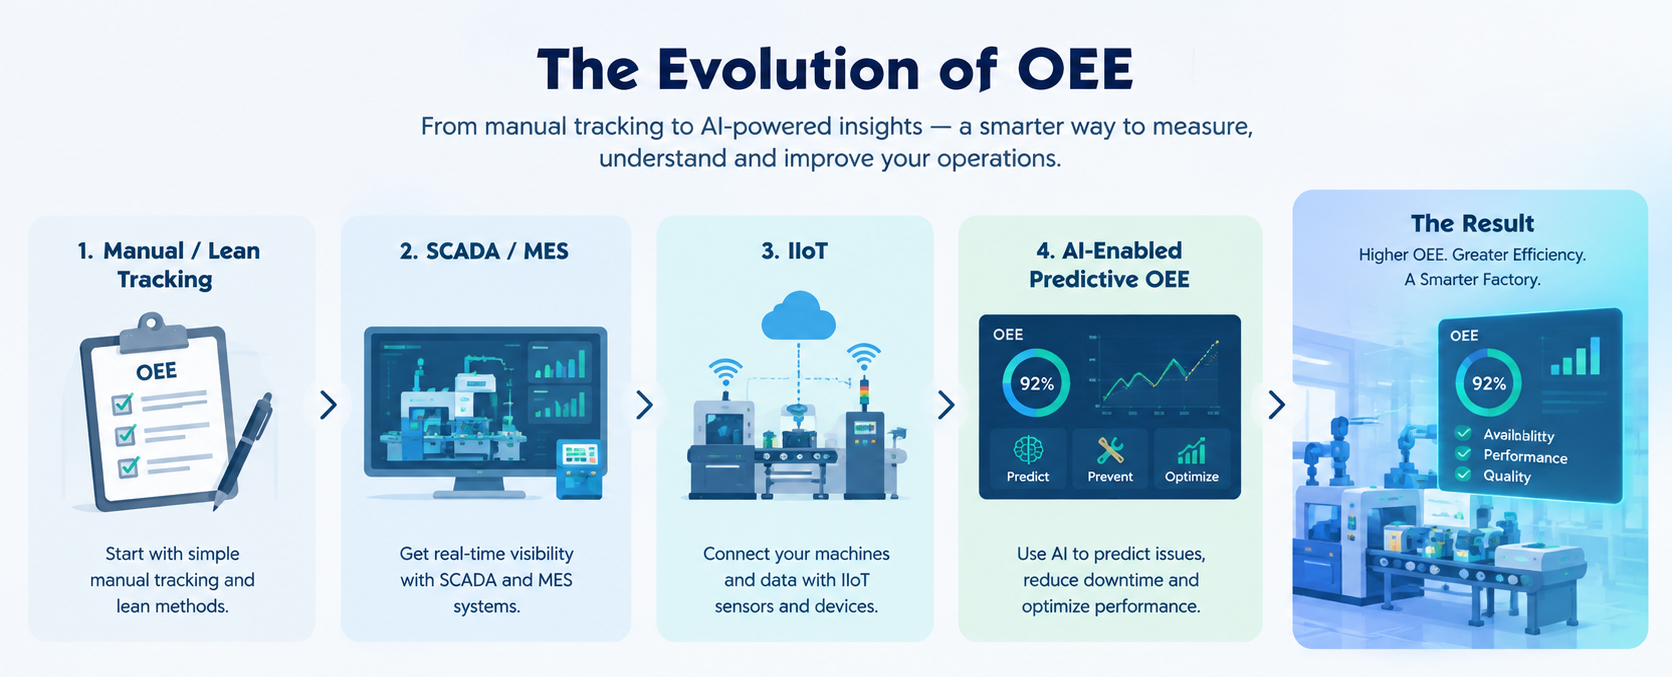
Overall Equipment Effectiveness (OEE) originated in Japanese manufacturing (TPM) in the 1960–80s, combining availability, performance and quality into a single metric. First formalized by Seiichi Nakajima (TPM’s founder) in the early 1980s, OEE built on earlier efficiency engineering principles (e.g. Harrington Emerson) and is now codified in standards (ISO 22400‑2, VDI 3423). OEE’s use has evolved in “generations”: initially manual/lean-era (paper charts, operator logs and TPM kaizen teams), then SCADA/MES-era (PLC and ERP integration for real-time OEE dashboards), followed by IIoT/digital OEE (smart sensors, cloud dashboards), and today AI-enhanced OEE (machine learning for prediction and optimization). Each era has typical tools (from whiteboards and spreadsheets to PLC tags to IIoT gateways to ML models), and trade‑offs. For example, one lean improvement project in pharmaceuticals raised OEE from ~45% to 75% in ten months (repaying its cost in ≪2 months), while a U.S. paper mill gained +4% OEE via structured maintenance and training. Modern digital implementations (e.g. an Ignition/SCADA upgrade) eliminated manual counting and compute OEE in real time. Today AI/IoT augments OEE via predictive maintenance and anomaly detection – studies report ~25–40% fewer failures and much more accurate loss diagnostics. However, these benefits require high‑quality data and careful change management: outdated/manual OEE data often have “delays” and “incomplete” information. Best practice is to start with pilots, standardize definitions, automate data capture and involve frontline teams (per TPM).
Origins of OEE
OEE emerged from Total Productive Maintenance (TPM) in Japan. Nakajima’s TPM books (early 1980s) codified OEE as a productivity metric combining Availability×Performance×Quality. (Some sources note Nakajima’s work dated to the 1960s.) OEE was later introduced to Western industry (e.g. Nakajima’s 1988 TPM text). Early 20th‑century efficiency engineers (like Emerson’s “efficiency” methods) provided conceptual background on performance metrics. Today OEE definitions are formalized in industry standards (ISO 22400‑2, VDI 3423), though actual implementation is tailored to each plant. Importantly, Nakajima’s TPM philosophy made OEE a continuous‐improvement KPI: “the goal is the continuous improvement of OEE by engaging all those that impact it in small group activities”.
Lean‐Era (Manual) OEE (1980s–2000s)
Tools/Data: Initially, OEE was calculated by hand using production logs, clock charts and spreadsheets. Lean/TPM teams used whiteboards or shift notebooks to record run times, counts, and downtime reasons. Operators tracked “Six Big Losses” through stopwatches or manual counters.
Characteristics: Data latency was daily or per shift (reports often came hours after production). Analytics were simple (hand‐plotted OEE trends, Pareto charts). OEE improvement focused on structured shop‐floor kaizen: for example, one pharmaceutical plant had operators record hourly output and triggered problem‑solving whenever targets failed. In practice this drove rapid OEE gains (in that case, OEE jumped from ~45% to 75% within ten months, with project costs recouped in under 2 months). Benefits: Low tech cost; engaged operators in root‐cause analysis; aligned with lean/TPM culture. Limitations: Labor‐intensive and error‑prone. Manual entry often missed short stops or nuanced reasons. As one review notes, such manual OEE systems “lead to delays in detecting problems” and “incomplete or delayed information”. Accuracy suffers (manual logs trade precision for context), and real‐time intervention is impossible.
SCADA/MES‐Integrated OEE (2000s–2010s)
Tools/Data: The next generation added plant automation. PLCs/SCADA and MES systems captured production data (counts, cycle times, machine status) directly. OEE modules (e.g. Sepasoft, Wonderware, SAP) aggregated this data. Integration with ERP allowed linking production orders to OEE. For example, a U.S. equipment maker replaced pen‑and‑paper OEE with an Ignition SCADA solution: operators now scan a work order barcode, and PLCs + software automatically log run time, parts, rejects, computing OEE real‐time.
Characteristics: Data latency dropped to minutes. Dashboards on HMI or PC showed live OEE and loss breakdowns. Analytics remained mostly descriptive (reporting losses per shift/equipment). Benefits: Greatly improved data accuracy (removing most transcription errors) and frequency. Real‐time visibility enabled faster response to breakdowns. Organizations could span across a plant (or multiple plants) since data was digital. Limitations: Required significant IT/OT integration. Initial costs (PLCs, SCADA licenses, MES) and configuration are high. Silos remain: OEE modules often work per line or plant, and analysis is still largely reactive. Data context (why a stop occurred) can be lost unless operators still enter notes.
IIoT/Digital OEE (2010s–present)
Tools/Data: Modern IIoT introduces ubiquitous sensors and connectivity. Beyond PLC counts, factories now equip machines with wireless vibration, temperature, energy and quality sensors. Data platforms (cloud/edge) ingest high‐frequency logs and logs from multiple sources. E.g. advanced CNC machines report tool wear and process parameters. Machine‐vision systems may inspect parts automatically. Characteristics: Continuous, real‐time OEE tracking becomes feasible. Latency is seconds, and analytics can include multivariate dashboards (correlating machine condition to OEE). Benefits: Enables new insights: for instance, one lab reported that IIoT + analytics predicted tool failures and quality issues, thereby minimizing downtime. IoT‐enabled monitoring raised equipment availability by ~25–30% and reduced downtime ~30–40% in trials. Advanced software can automatically attribute losses (e.g. separating machine vs. material downtime). Limitations: The data volume and variety grow exponentially, requiring data engineers. Ensuring all sensors are calibrated and connected is nontrivial. Cybersecurity and networking (proprietary PLC vs IoT protocols) become issues. Many companies now have “big data” but struggle to use it effectively. Retrofitting legacy equipment can be costly.
AI‐Enabled OEE (Present/Future)
Tools/Data: The latest OEE systems layer AI and ML on top of the digital data. Predictive models (e.g. LSTM, random forest, reinforcement learning) ingest historical OEE and sensor data. These systems can forecast machine health, detect anomalies, and even suggest optimal schedules. For example, research demonstrated a “predictive OEE” approach using LSTM+DQN to anticipate a tool’s future effectiveness. Applications: AI augments all OEE pillars: it can predict failures (improving Availability), forecast quality drift, and optimize cycle times. Machine vision and anomaly detection can flag defects (Quality). ML can uncover hidden root causes from patterns (Performance). Industrial pilots show that AI PdM can simultaneously reduce unplanned downtime and speed losses, “attacking all three pillars of OEE”. Intel notes that AI‐enabled PdM lets plants “plan ahead” and thus maximize uptime and OEE. Benefits: When well‑implemented, AI adds predictive and prescriptive capabilities: failures can be anticipated before they halt production, and maintenance can be scheduled optimally. Several case studies (Injection molding, metalworking) report substantially better OEE using ML for quality prediction and scheduling. Limitations: AI solutions hinge on data quality. Garbage inputs yield useless forecasts. AI models can be “black boxes,” raising trust issues among operators. Integration with legacy MES/ERP remains complex. Moreover, ROI is not guaranteed: building and validating models takes time and expertise. If downtime causes aren’t accurately tagged in the data, ML may misattribute losses. Hence, AI‐OEE is still emerging: it offers great promise (e.g. “predictive maintenance…to improve machine performance and OEE”) but also faces explainability and integration challenges.
Case Studies / Examples
- Lean/Manual Improvement: A global pharma line applied lean kaizen and simple OEE tracking (hourly output boards, root-cause sessions) and boosted OEE from ~45% to 75%. This translated to a 60% output increase on that line, with project costs recovered in just 2 months.
- Maintenance‐Driven OEE Gain: An ABB case study at a U.S. paper mill used structured maintenance planning and operator training. The result was a +4 percentage‐point OEE gain across three paper machines (and a better maintenance spend/asset value ratio).
- SCADA Automation: Ariens (landscaping equipment manufacturer) automated OEE data collection by deploying PLCs, barcode scans and an Ignition/SCADA system. This moved them from error‐prone manual entry to real-time OEE computation plant-wide.
- IIoT/AI Analytics: Academic and pilot projects demonstrate modern OEE enhancements. For example, sensors on a CNC cell have been used to predict tool wear and dynamically adjust machining parameters; simulations show this increases availability and quality. Systematic reviews of IoT+OEE note that smart monitoring can raise availability ~25–30% and cut downtime ~30–40%. Many industry 4.0 platforms now offer “digital OEE” dashboards that integrate machine data, operator input and analytics (e.g. predictive alarms).
Comparing OEE Generations
Attribute |
Manual / Lean OEE |
SCADA / MES OEE |
IIoT / Digital OEE |
AI-Enhanced OEE |
|---|---|---|---|---|
Data Sources |
Operator logs, shift sheets, counters | PLC/HMI signals, SCADA and MES databases, ERP | IoT sensors (vibration, temp, quality checks), edge devices, databases | All digital sources + historical production data, cloud data lakes |
Data Latency |
Hours–days (post-shift reports) | Minutes–hours (automated collection) | Real-time (seconds) | Real-time plus predictive (hours/days ahead) |
Analytics |
Manual calculation, spreadsheets, charts | Dashboards, basic SQL/MES reports | Real-time dashboards, root-cause analytics | Advanced: ML-based predictions, anomaly detection, simulations |
Typical ROI / Benefits |
Moderate. Low cost; OEE gains via CI. ROI often <1 year. | Moderate. Improved visibility reduces errors; ROI in 6–18 months if used well. | High potential. Predictive maintenance and optimization can boost throughput 10–30%. Requires investment in IoT/hardware. | Variable. Can yield significant gains if data mature (15–30%+ uptime improvement), but also high upfront cost and complex payback. |
OEE in the AI Era: Opportunities and Challenges
Opportunities: AI and analytics fundamentally extend OEE from a diagnostic metric to a predictive tool. For example, ML models can forecast Remaining Useful Life so maintenance is scheduled just before a failure, maximizing Availability. They can analyze sensor streams to flag subtle anomalies (vibrations, process drifts) that would otherwise cause slowdowns or defects, thus protecting Performance and Quality. Integrated software can automatically correlate OEE losses with causes (e.g. linking downtime logs to OEE drops, or simulating “what-if” scenarios for schedule changes). In effect, AI can turn OEE into a prescriptive system: recommending how to adjust production schedules or preventive actions to hit target OEE and financial KPIs.
Challenges: Realizing these gains is nontrivial. High‐quality data is essential: as one review warned, traditional manual OEE tracking often produces “inaccurate classification” of stoppages because of incomplete or delayed data. If sensors miss events or timestamps don’t align, ML models will be misled. Also, advanced analytics can be a “black box”: plant engineers may not trust an opaque model over their intuition. Integration is another hurdle – AI systems must pull together data from ERP, PLCs, CMMS, quality inspection, etc., which often use different formats. Finally, cultural factors matter: shop-floor staff and managers must be trained to interpret AI-driven OEE insights and align them with lean/TQM practices.
Practical Recommendations: We suggest practitioners approach AI‐OEE systematically:
- Ensure Data Fidelity: Start by improving OEE data capture. Automate where possible (IoT sensors, machine data links) to eliminate manual gaps. Standardize OEE definitions and data labels across the plant (as “single source of truth” can’t be achieved otherwise). Audit existing OEE logs for consistency.
- Engage Frontline Teams: Don’t lose the human insights. Equip operators to annotate any automated logs (for example, requiring them to enter an undoctored stop reason via an HMI). Recall TPM practice: continual, small‐group fixes (e.g. focusing on one big loss at a time) led to sustainable OEE gains. Combine this with analytics – use AI insights as a catalyst for daily improvement huddles.
- Pilot and Scale: Choose a critical machine or line as a pilot. Integrate one data source at a time (e.g. first capture run time, then add scrap/downtime inputs). Validate models before roll-out. For instance, ensure an AI model’s failure forecasts match known incidents.
- Use Explainable AI and KPIs: Prefer algorithms that allow interpretability (decision trees, feature ranking, etc.) so engineers can verify predictions. Tie OEE targets to financial KPIs (using, for example, a DuPont analysis like ABB suggests). Celebrate wins in productivity or cost savings to justify continued AI investment.
- Iterate Continuously: AI models drift as processes change. Implement feedback loops so model predictions and actual OEE outcomes are monitored. Adjust sensor setups and data schemas as needed. Ultimately, the goal is to fuse “big data” analytics with the lean/TPM culture of continuous improvement.
Sources: Authoritative books and standards define OEE (ISO 22400‑2). Recent academic reviews and industry whitepapers were used, e.g. Yuan et al. on CNC OEE analytics, as well as case studies from vendors (ABB, Inductive Automation) and lean consultancies. These sources provide the basis for the above historical overview, technology evolution, case examples, and recommendations.